The CDP Private Map Maker v0.2
We've released version 0.2 of the CDP Private Map Maker - A new way to release sensitive map data! (Requires Silverlight.)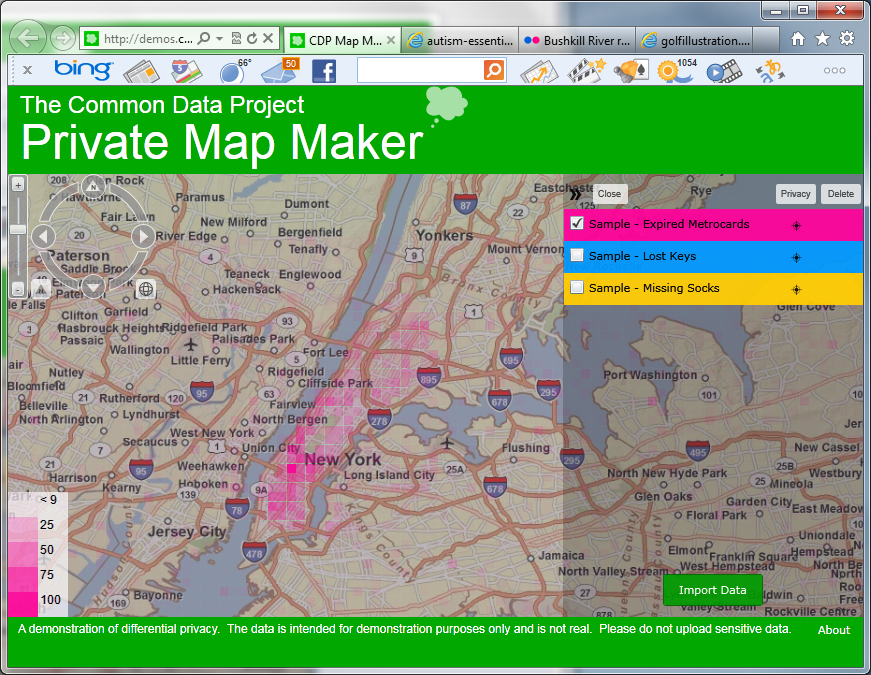
Speedy, but is it safe?
Today, releasing sensitive data safely on a map is not a trivial task. The common anonymization methods tend to either be manual and time consuming, or create a very low resolution map.Compared to current manual anonymization methods, which can take months if not years, our map maker leverages differential privacy to generate a map programmatically in much less time. For the sample datasets included, this process took a couple of minutes.However, speed is not the map maker's most important feature, safety is, through the ability to quantify privacy risk.
Accounting for Privacy Risk, Literally and Figuratively
We're still leveraging the same differential privacy principles we've been working with all along. Differential privacy not only allows us to (mostly) automate the process of generating the maps, it also allows us to quantitatively balance the accuracy of the map against the privacy risk incurred when releasing the data. (The purpose of the post is not to discuss whether differential privacy works--it's an area of privacy research that has been around for several years and there are others better equipped to defend its capabilities.)Think of it as a form of accounting. Rather than buying what appears to be cost-effective and hoping for the best, you can actually see the price of each item (privacy risk) AND know how accurate it will be.Previous implementations of differential privacy (including our own) have done this accounting in code. The new map maker provides a graphical user interface so you can play with the settings yourself.More details on how this works below.
Compared to v0.1
Version 0.2 updates our first test-drive of differential privacy. Our first iteration allowed you to query the number of people in an arbitrary region of the map, returning meaningful results about the area as a whole without exposing individuals in the dataset.The flexibility that application provided as compared to pre-bucketed data is great if you have a specific question, but the workflow of looking at a blank map and choosing an area to query doesn’t align with how people often use maps and data. We generally like to see the data at a high level, and then dig deeper as needed.In this round, we're aiming for a more intuitive user experience. Our two target users are:
- Data Releaser The person releasing the data who wants to make intelligent decisions about how to balance privacy risk and data utility.
- Data User The person trying to make use of the the data, who would like to have a general overview of a data set before delving in with more specific questions.
As a result, we've flipped our workflow on it's head. Rather than providing a blank map for you to query, the map maker now immediately produces populated maps at different levels of accuracy and privacy risk.We've also added the ability to upload your own datasets and choose your own privacy settings to see how the private map maker works.
However, please do not upload actually sensitive data to this demo.
v.02 is for demonstration purposes only. Our hope is to create a forum where organizations with real data release scenarios can begin to engage with the differential privacy research community. If you're interested in a more serious experiment with real data, please contact us.Any data you do upload is available publicly to other users until it is deleted. (You can delete any uploaded dataset through the map maker interface.) The sample data sets provided cannot be deleted, and were synthetically generated - please do not use the sample data for any purpose other than seeing how the map maker works - the data is fake.You can play with the demo here. (Requires Silverlight.)Finally, a subtle, but significant change we should call out: - Our previous map demo leveraged an implementation of differential privacy called PINQ, developed at Microsoft Research. Creating the grids for this map maker required a different workflow so we wrote our own implementation to add noise to the cell counts, using the same fundamentals of differential privacy.
More Details on How the Private Map Maker Works
How exactly do we generate the maps? One option – Nudge each data point a little
The key to differential privacy is adding random noise to each answer. It only returns aggregates so we can’t ask it to ‘make a data point private’, but what if we added noise to each data point by moving it slightly? The person consuming the map then wouldn’t know exactly where the data point originated from making it private, right?The problem with this process is that we can’t automate adding this random noise because external factors might cause the noise to be ineffective. Consider the red data point below.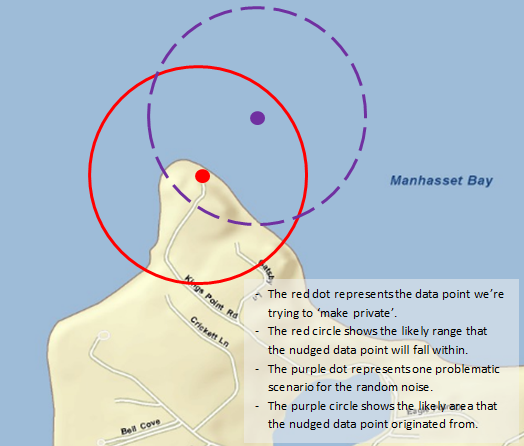 If we nudge it randomly, there’s a pretty good chance we’ll nudge it right into the water. Since there aren’t residences in the middle of Manhasset Bay, this could significantly narrow down the possibilities for the actual origin of the data point. (One of the more problematic scenarios is pictured above.) And water isn’t the only issue—if we’re dealing with residences, nudging into a strip mall, school, etc. could cause the same problem. Because of these external factors, the process is manual and time consuming. On top of that, unlike differential privacy, there’s no mathematical measure about how much information is being divulged—you’re relying on the manual review to catch any privacy issues.
Another Option – Grids
As a compromise between querying a blank map, and the time consuming (and potentially error prone) process of nudging data points, we decided to generate grid squares based on noisy answers—the darker the grid square, the higher the answer. The grid is generated simply by running one differential privacy-protected query for each square. Here’s an example grid from a fake dataset: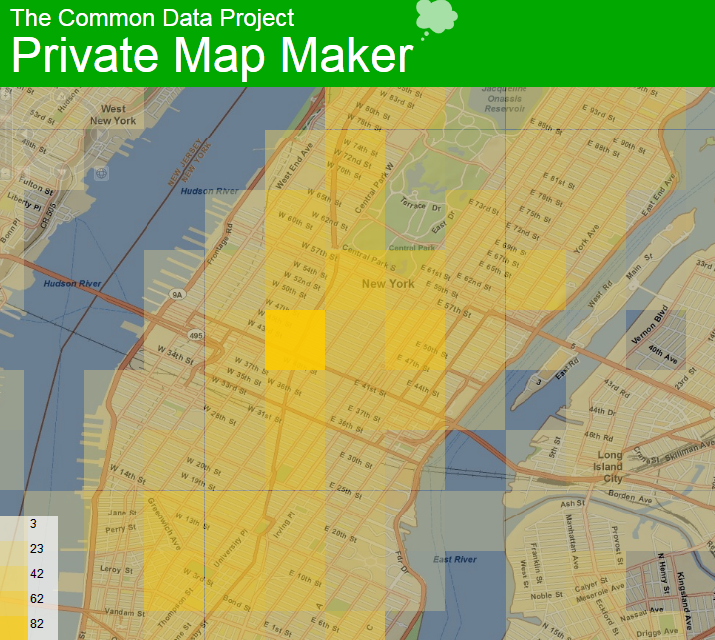 “But Tony!” you say, “Weren’t you just telling us how much better arbitrary questions are as compared to the bucketing we often see?” First, this isn’t meant to necessarily replace the ability to ask arbitrary questions, but instead provides another tool allowing you to see the data first. And second, compared to the way released data is often currently pre-bucketed, we’re able to offer more granular grids.
Choosing a Map
Now comes the manual part. There are two variables you can adjust when choosing a map: grid size and margin of error. While this step is manual, most of the work is done for you, so it's much less time-intensive than moving data points around. For demonstration purposes, we currently generate several options which you can select from in the gallery view. You could release any of the maps that are pre-generated as they are all protected by differential privacy with the given +/- --but some are not useful and others may be wasting privacy currency.Grid size is simply the area of each cell. Since a cell is the smallest area you can compare (with either another cell or 0), you must set it to accommodate the minimum resolution required for your analysis. For example, using the map to allocate resources at the borough level vs. the block level require different resolutions to be effective. You also have to consider the density of the dataset. If your analysis is at the block level, but the dataset is very sparse such that there's only about one point per block, the noise will protect those individuals, and the map will be uniformly noisy.Margin of error specifies a range that the noisy answer will likely fall within. The higher the margin of error, the less the noisy answer tells us about specific data points within the cell. A cell with answer 20 +/- 3 means the real answer is likely between 17 and 23. While an answer of 20 +/- 50 means the real answer is likely between -30 and 70, and thus it’s reasonably likely that there are no data points within that cell at all.To select a map, first pan and zoom the map to show the portion you’re interested in, and then click the target icon for a dataset.
When you click the target, a gallery with previews of the nine pre-generated options are displayed.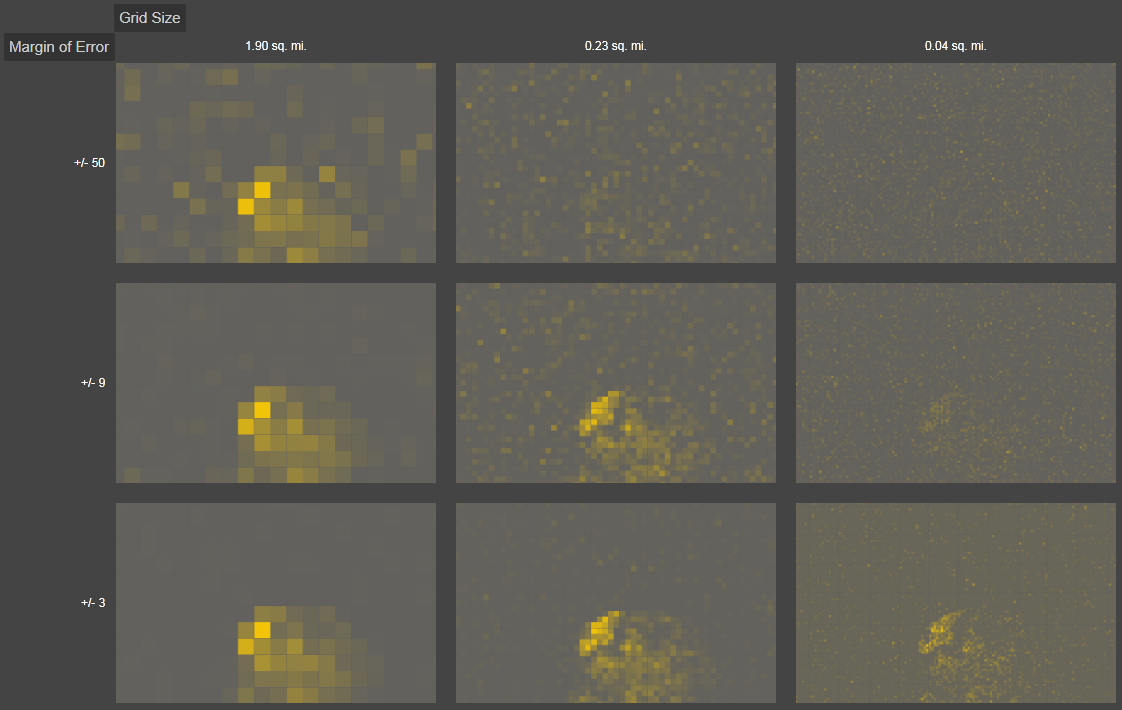 As an example, let's imagine that I'm doing block level analysis, so I'm only interested in the third column:
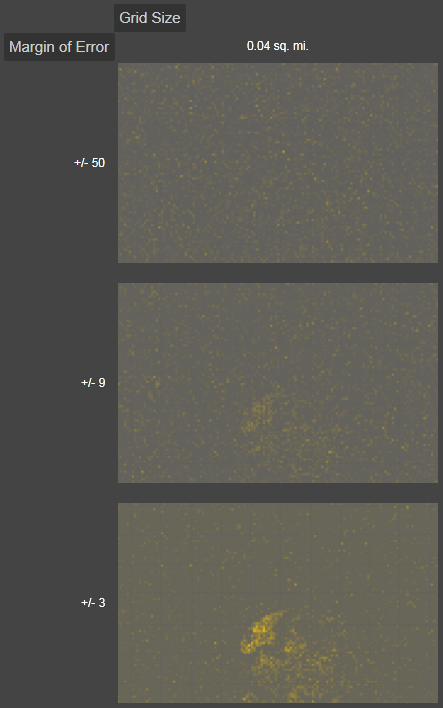 This sample dataset has a fairly small amount of data, such that in the top cell (+/- 50) and to some extent the middle cell (+/- 9), the noise overwhelms the data. In this case, we would have to consider tuning down the privacy protection towards the +/- 3 cell, in order to have a useful map at that resolution. (For this demo, the noise level is hard-coded.) The other option is to sacrifice resolution (moving left in the gallery view), so there are more data points in a given square and thus won't be drowned out by higher noise levels.Once you have selected a grid, you can pan and zoom the map to the desired scale. The legend is currently dynamic such that it will adjust as necessary to the magnitude of the data in your current view.
